Facilitated a survey to baseline freelancer satisfaction in different areas and track satisfaction over time.
Background
Freelancers transcribe and caption audio and video files on the platform. It was decided that in order to prioritize features and updates we needed to assess the current satisfaction. The plan was to send the survey out twice a year, to keep a pulse on freelancer satisfaction and how it related to feature changes.
Research Questions
The main goal is to assess satisfaction in the different areas of the freelancer experience.

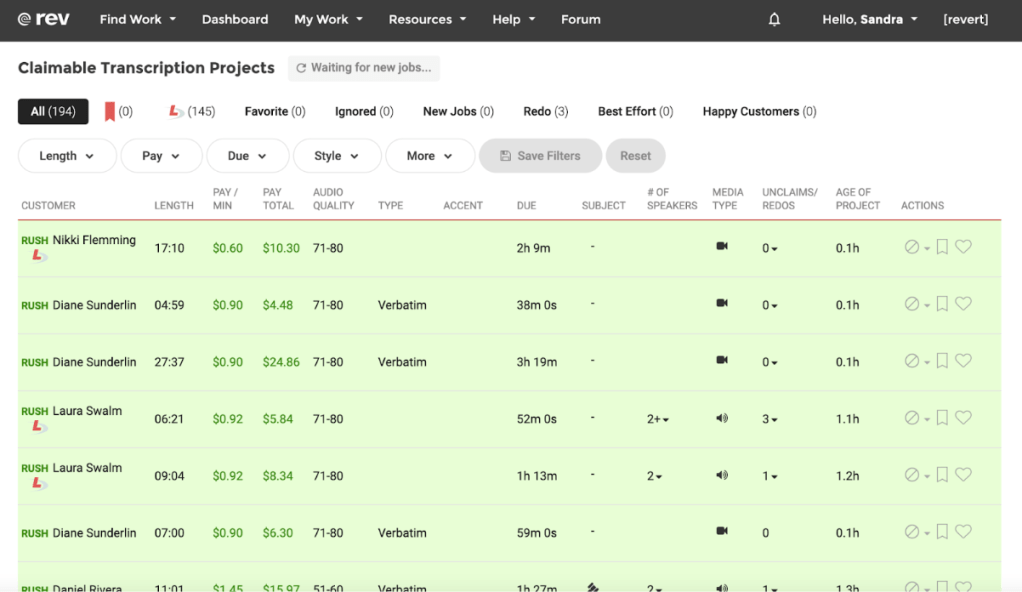
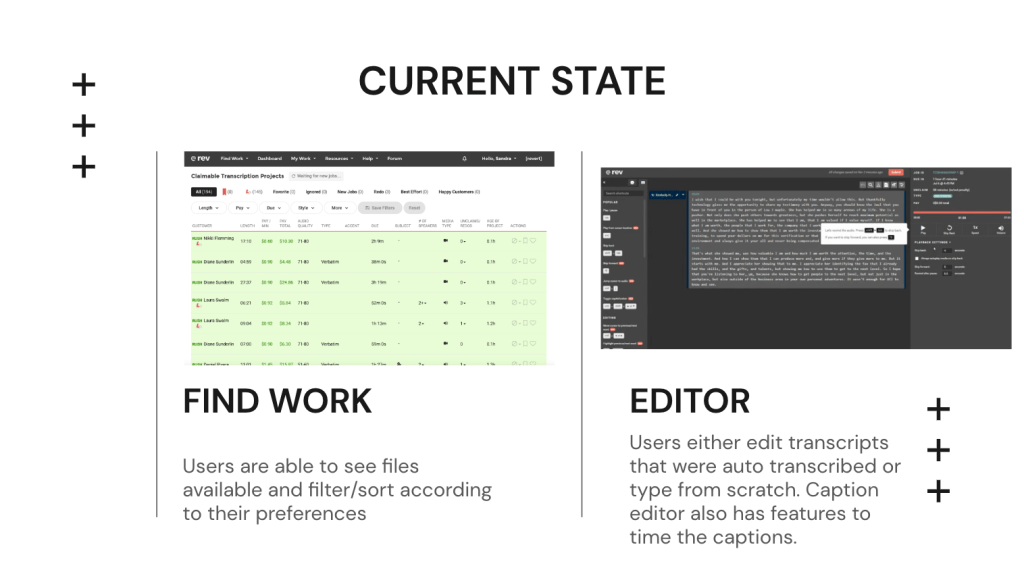
Current State
Freelancers have various tools available. They can choose jobs, use the editor to edit and type audio/video, see their metrics, join the forum, and contact support, among others.
Role and Collaboration
I worked with another researcher to conduct the survey and was responsible for two of the three segments. We both also took the opportunity to show designers on the team how we conduct and analyze qualitative answers from a survey.

Research Methods
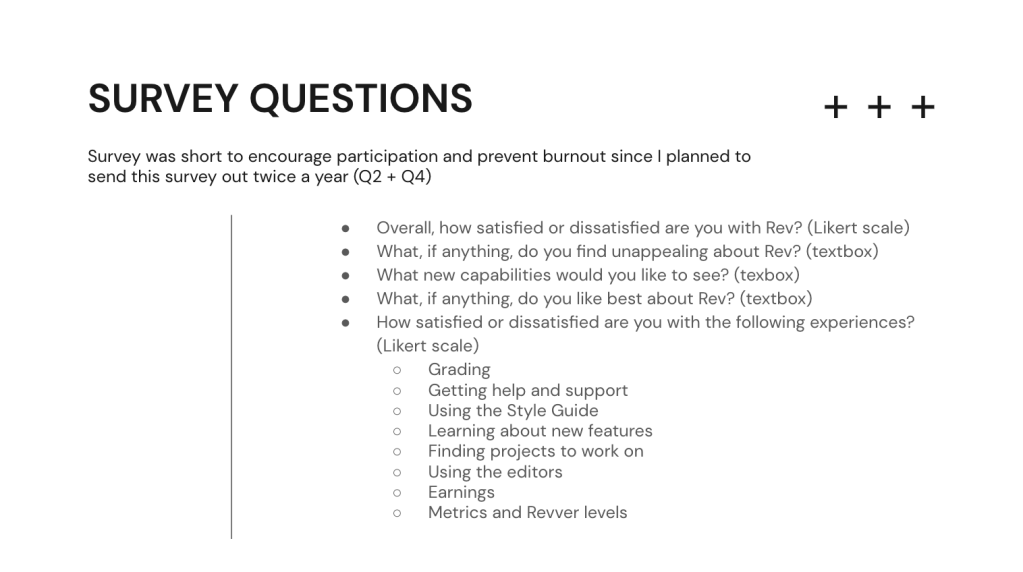
The survey was kept short to prevent survey fatigue. Two qualitative questions were asked to get additional feedback on the quantitative answers.

Timeline
Each qualitative answer was reviewed and tagged, which accounts for a longer time to analyze the results.

Recruitment
Notifications to participate in the survey were sent to the freelancer platform through Beamer. The survey was available until we got enough responses from each segment.

Survey Questions
Questions included Likert and text boxes.
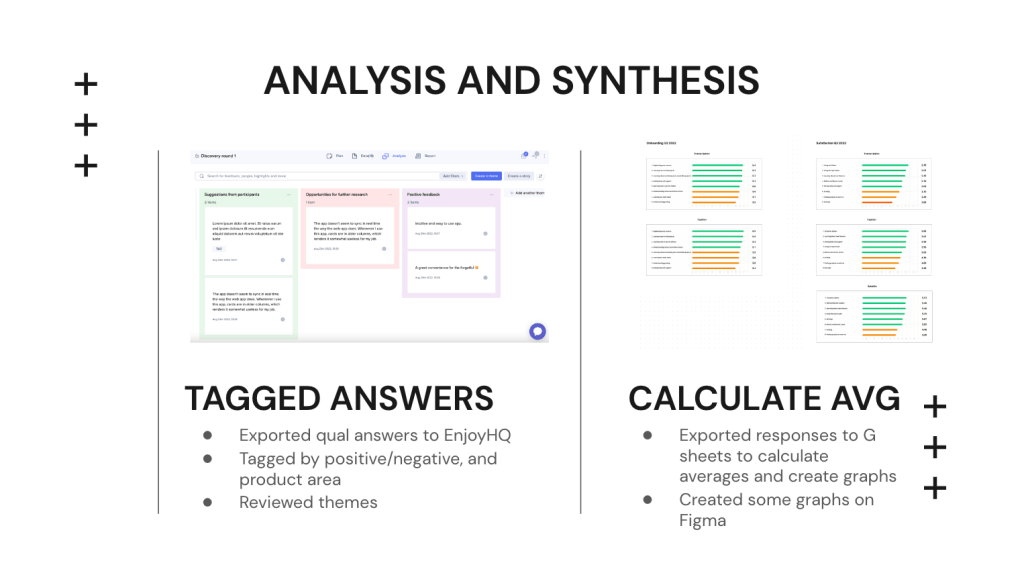
Analysis and Synthesis
Qualitative answers were exported to EnjoyHQ. They were tagged by “Positive” or “Negative” and by product area. Averages were calculated from qualitative responses and graphs were created on Figma.
Main Insights
For the three segments, the results were similar. There is dissatisfaction with earnings and finding work, and satisfaction with the editors they use to complete the work. Qualitative answers provided more details on why earning and finding work is important, and what motivates freelancers.

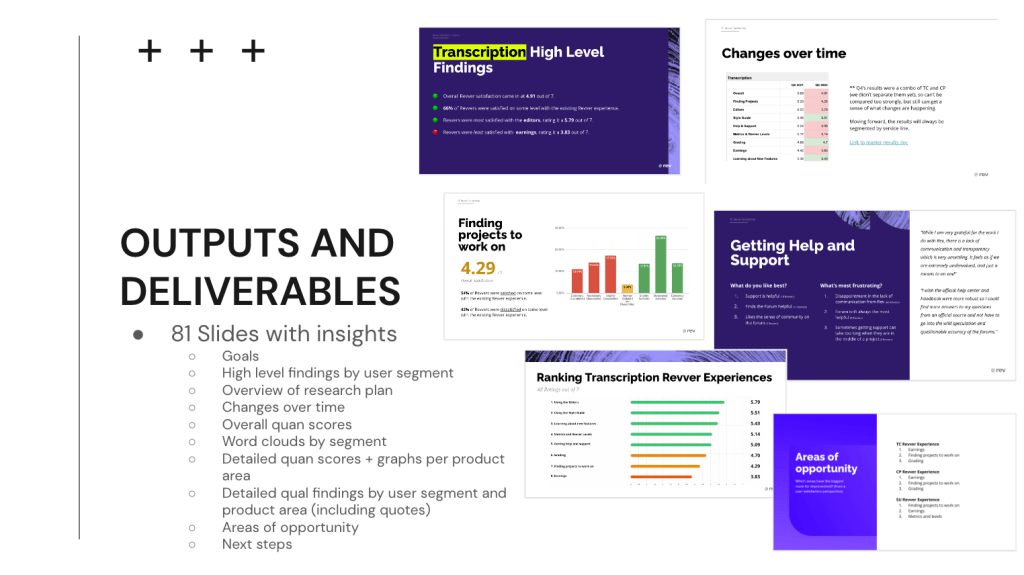
Outputs and Deliverables
Results were presented to the Product, Design, and Operations teams. Slides included quantitative results for each section, graphs, quotes, and the main positive and negative insights for each section.
UI/UX Impact
Qualitative answers pointed to bugs that were sent to Engineering to add to their backlog. We were also able to provide data to confirm feature priorities in the product backlog.

Big Picture Impact
Research projects were planned with other departments to understand big themes that were discovered from the survey.

Next Steps
Along with making plans to send the survey out again in six months, meetings were scheduled to discuss future research projects related to the insights.

Reflection
The survey allowed us to validate existing qualitative insights, along with becoming a benchmark to compare future feature improvements.